-

The Slide Deck That Changes the Conversation: Safety Perception Data Your Board Has Never Seen
Key Takeaways You’re building the slide deck for Thursday’s executive team meeting. The board HR committee wants to know why behavioral health turnover keeps climbing despite competitive pay adjustments. Exit interviews surface “safety concerns” again and again. But your engagement survey buries safety questions inside a 50-item instrument scored once a year. Your incident reports…
-

Walk Into the Unit Meeting With Numbers, Not Reassurance
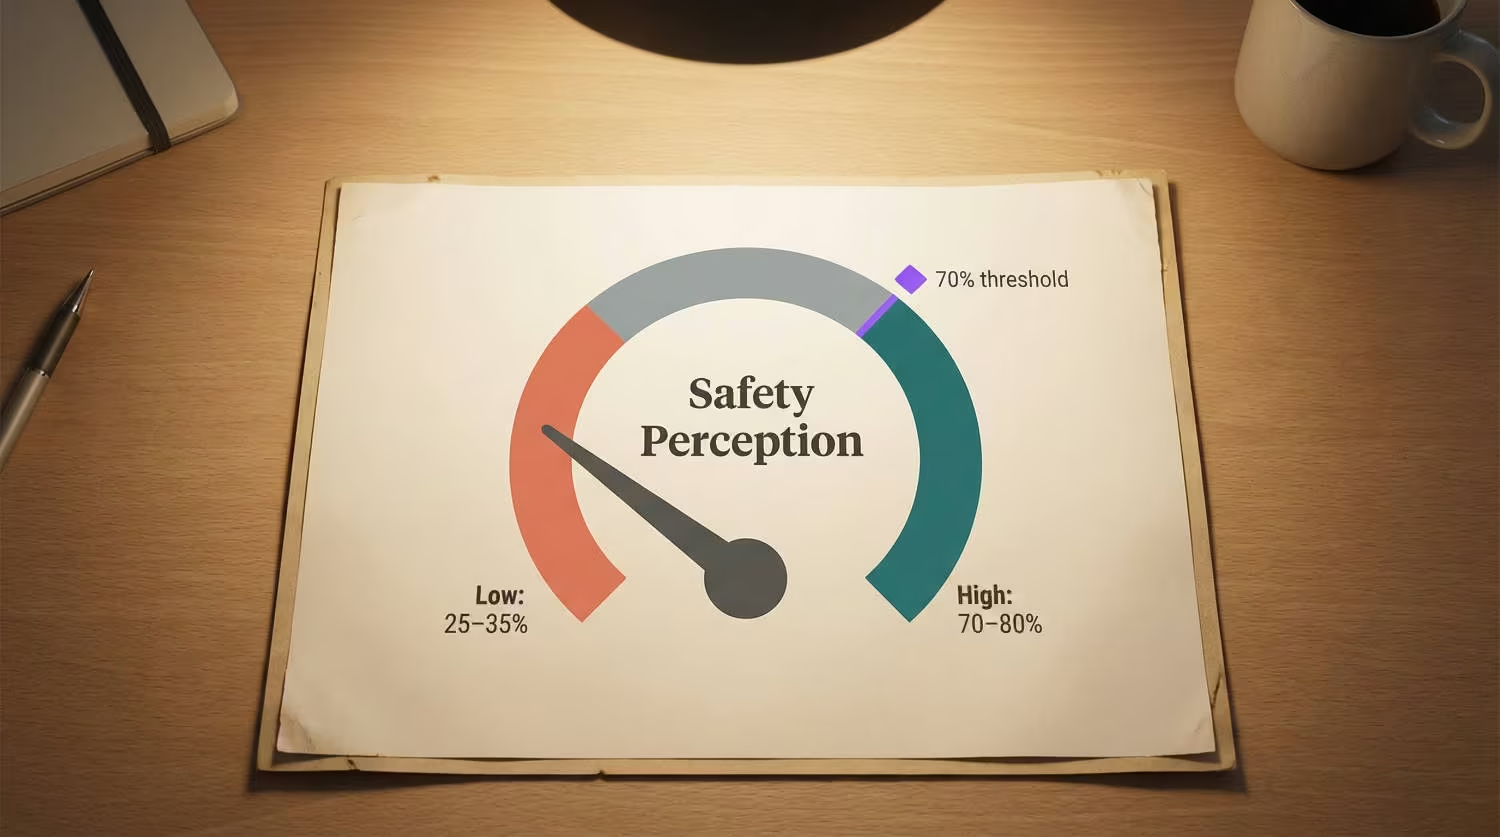
Key Takeaways Staff preparedness to respond to safety incidents jumped from 38% to 76% in a single pilot period [1]. That before-and-after shift changes the conversation. When your charge nurse asks, “Is this new system actually making a difference?” you need more than reassurance. This nursing safety brief gives you the specific perception metrics to…
-

Build a Safety Perception Measurement Framework That Predicts Nurse Turnover 90 Days Out
Key Takeaways You’ve been staring at your turnover dashboard for months. The numbers keep climbing, but the exit interviews are vague. Nobody writes “I don’t feel safe” on their way out the door. That’s the problem. Your dashboard captures departures. It doesn’t capture the perception driving them. This guide walks through building a safety perception…
-
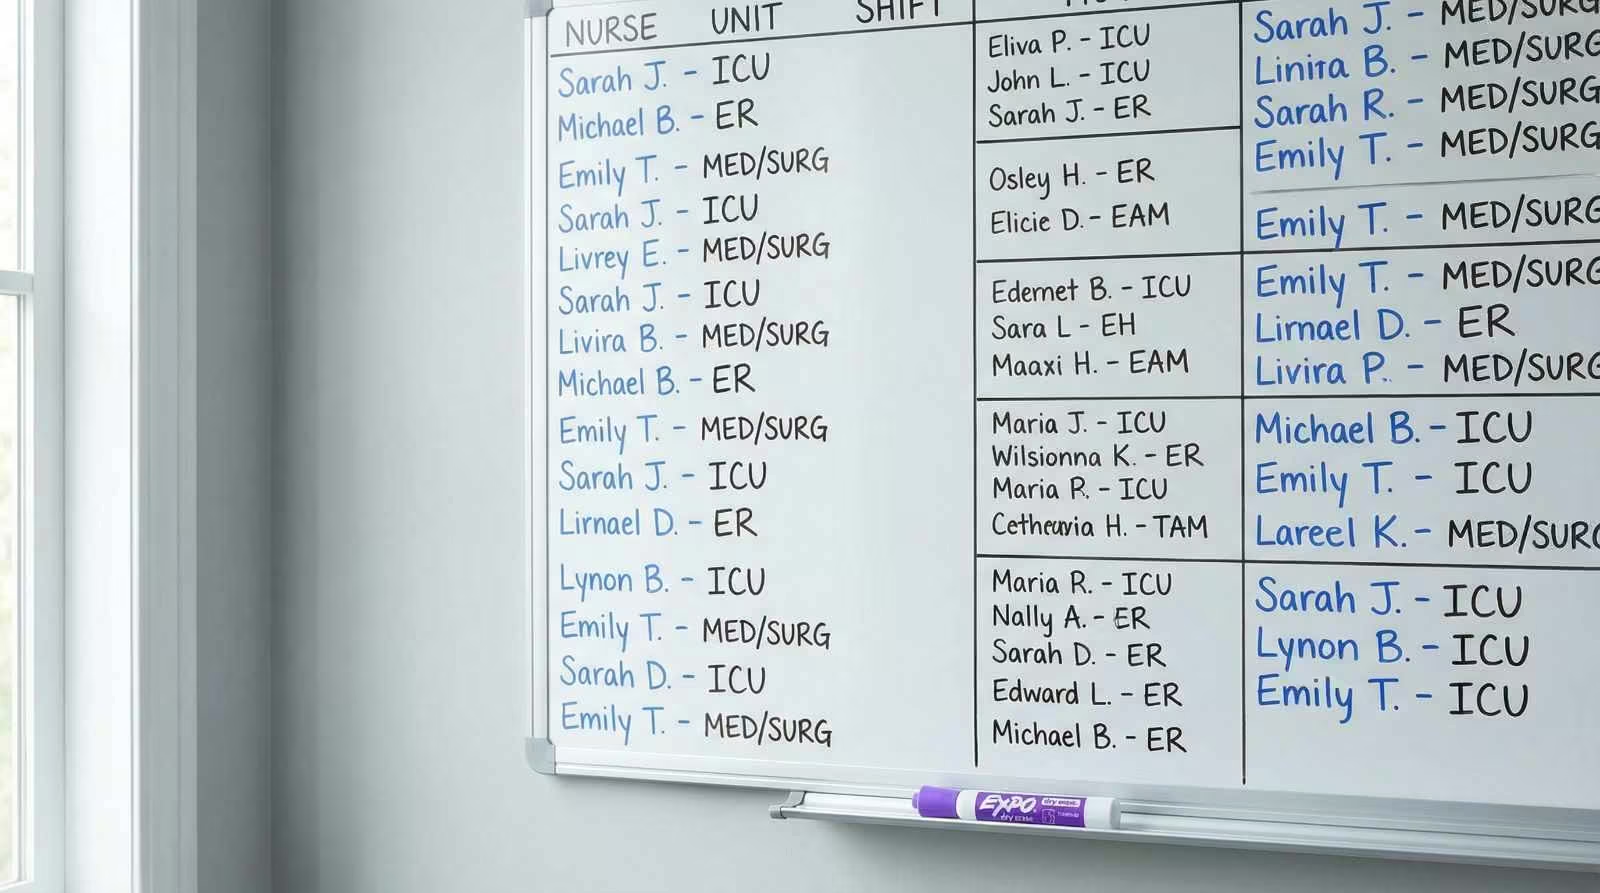
The Whiteboard Still Has Names on It. But This Time, They’re Staying.
Key Takeaways You’re standing at the whiteboard during your morning staffing huddle. Scanning which units are short. Figuring out where the float nurses need to go. Two experienced nurses gave notice last week. Both exit interviews cited safety concerns. But when you pulled the incident data, the numbers looked stable. This is the gap that…
-
The 35-Point Perception Gap Between Facilities That Keep Nurses and Facilities That Keep Losing Them
Key Takeaways The pattern in your latest engagement survey results is familiar. Units with the highest turnover are the same units where staff rate safety lowest. Exit interviews confirm it. Union grievances echo it. The connection between safety perception and retention isn’t theoretical. It shows up in every workforce dashboard you pull. This staff safety…
-
A Correlation of Negative 0.883: What Safety Perception Data Actually Predicts About Nurse Turnover
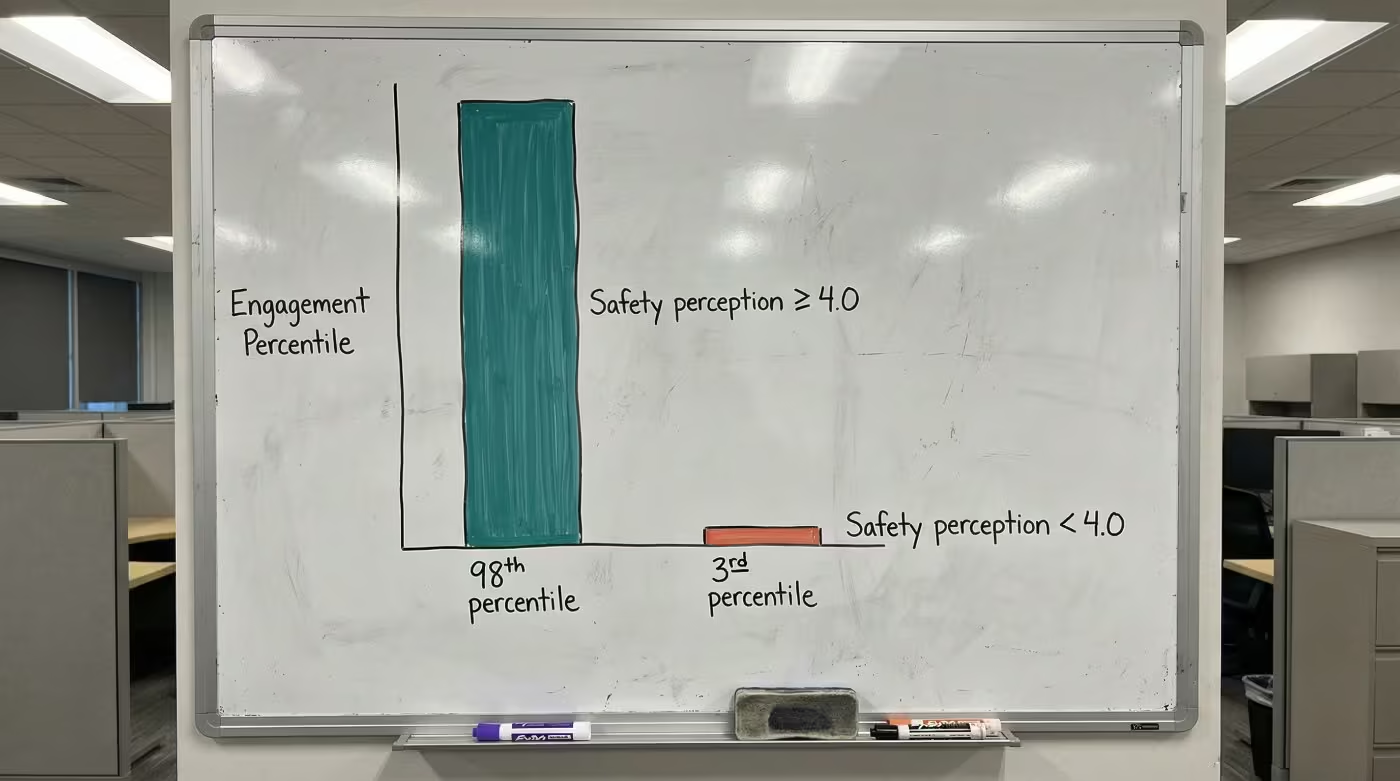
Key Takeaways The Gap Between Safety Importance and Safety Experience Staff rate the importance of safety at 4.7 out of 5. Fully 83.7% call it “extremely important.” Yet satisfaction with existing safety processes averages only 3.5 out of 5 [1]. That 1.2-point perception gap drives behavior. Chief Human Resources Officers (CHROs) see it surface in…
-
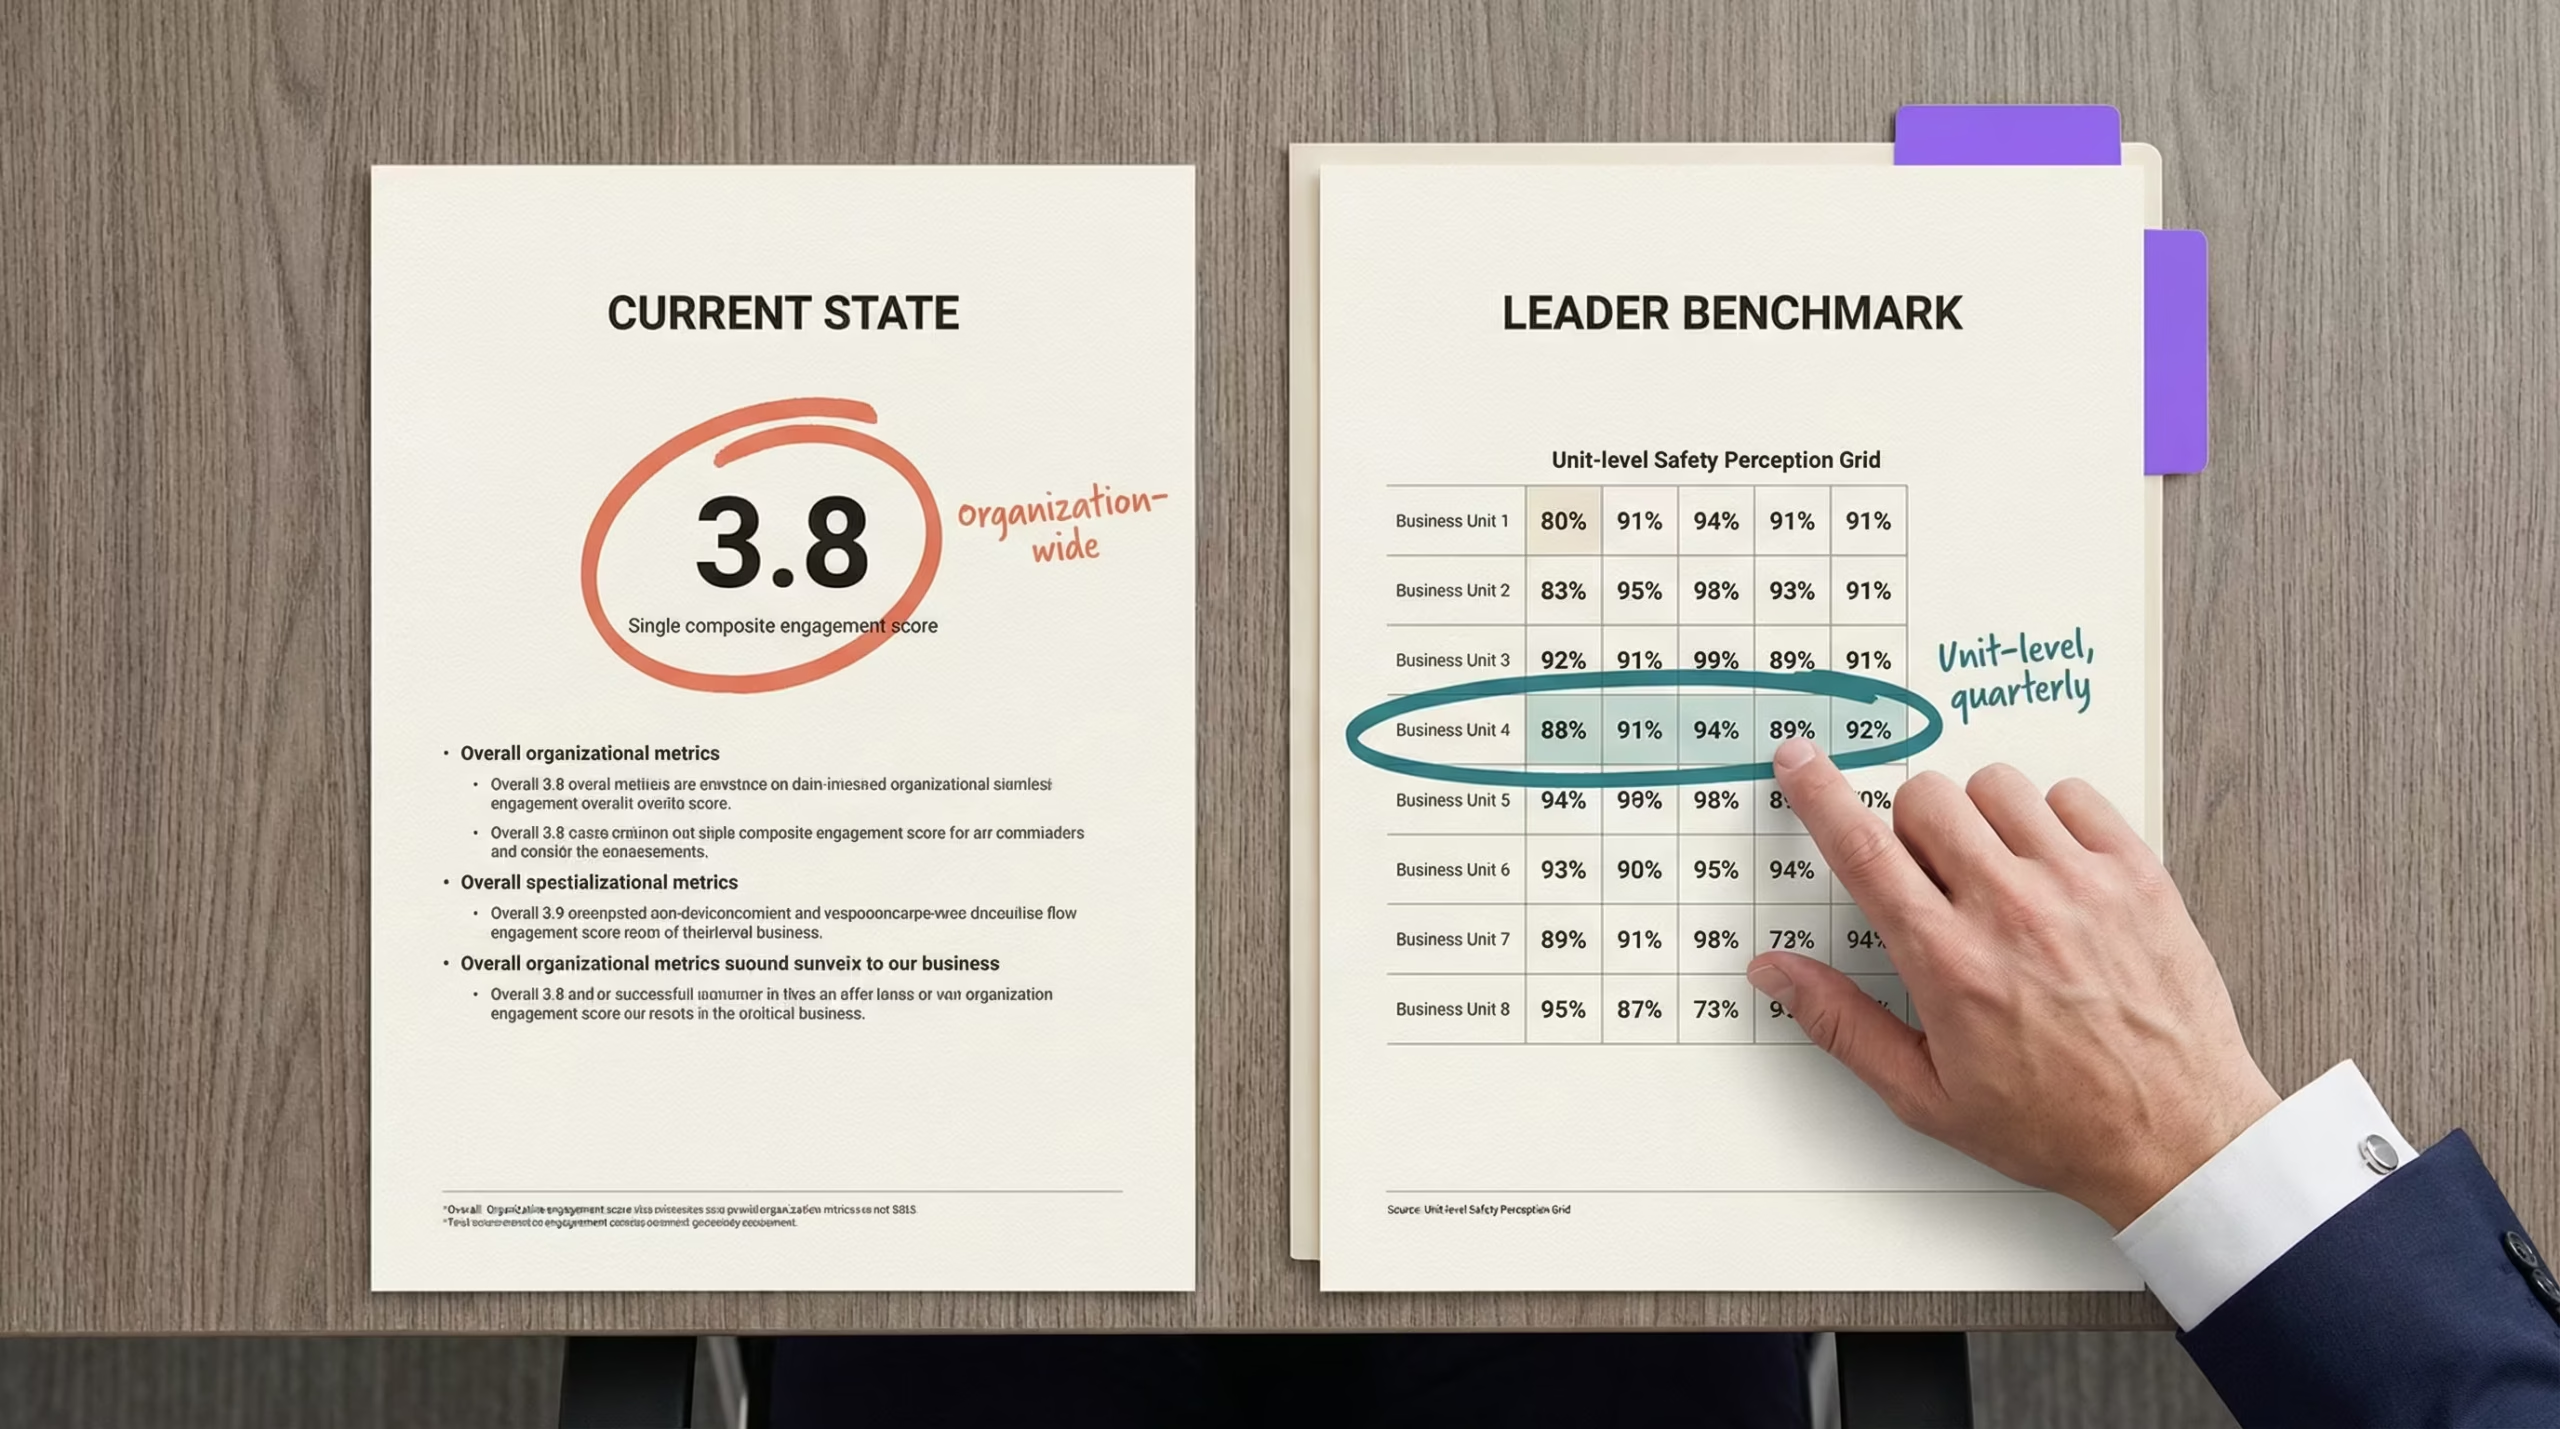
What Your Peers Already Know About Safety Perception That Keeps Their Best Nurses Staying
Key Takeaways You pull up your quarterly turnover report and the numbers look familiar. Behavioral health units running above 22%. Exit interviews citing safety concerns. Engagement scores flat. You track departures religiously. But peer CHRO safety insights from leading behavioral health settings reveal a different approach entirely. The CHROs pulling ahead aren’t measuring turnover more…
-

The Complete Guide to Staff Safety in Psychiatric Hospitals: From Perception Measurement to Workforce Stability
Key Takeaways Your vacancy dashboard shows behavioral health nursing turnover at 22.8%. The highest of any specialty in your system [1]. Exit interviews keep surfacing “safety concerns” as a contributing factor. But when you cross-reference incident reports, the numbers look stable. The disconnect isn’t a data error. It’s a measurement gap. You’re tracking the aftermath…